My team and I have had a dreadful couple of weeks.
Network issues, license issues, Windows issues, compiler issues, flip-floping test results etc., all of them piled one on top of the other and driving us nuts. With some of these issues we have to live with and compromise (I have a rant, a crazed, raving mad rant about companies forcing you to generate development licenses every week).
We also scaled out our CI infrastructure. Do not imagine anything huge, we went from 4 nodes running on 6-year old hardware to 16 nodes running on modern i5s, but that still means that we now have to keep an eye on 16 nodes instead of 4.
The work never stops and we needed a health monitor for the nodes something quick, so we cobbled something together using the Jenkins Job & Pipeline DSLs.
What you need
Jenkins 2.x with the build-monitor-plugin plugin.
All of the nodes.
We have fixed CI nodes - none of that dynamic mumbo-jumbo with Docker or AWS. The reason is simple:
We need Windows and we build embedded software and test on target.
We just ask Jenkins to tell us how many nodes are registered and then create one job for each node, naming the job after the node:
def content = new URL('http://localhost:8080/computer/api/xml?
wrapper=slaves&xpath=//computer/displayName').getText()
def build_nodes = new groovy.util.XmlSlurper().parseText(content)

for(int i = 0; i < build_nodes.displayName.size(); i++){
  def index=i
  def nodeName=build_nodes.displayName[index].text()
    //the job definition - skipped for clarity, see below
  }
}
I tried to use the Jenkins API (the hudson.model.* and jenkins.model.*) but quickly gave up because of major Groovy-Java dissonance and totally uninformative messages.
So the code above queries the HTTP API - this would be more complicated if we had authentication turned on, but we don’t ;).
The job definition is simple: Run every 3 minutes and take the node name as a parameter. It is also totally generic, pulling the pipeline definition off our repo.
pipelineJob(nodeName)
{
  description "Monitors ${nodeName}.
  Failure signifies the node is offline, abort status that it
  has been taken offline and an unstable status means maintenance
  is required - with details in the log."
  logRotator {
    daysToKeep(7)
  }
  triggers {
      cron('*/3 * * * *')
  }
  parameters {
    stringParam('STATION',nodeName,'The station to monitor')
  }
  definition {
    cps {
      script(readFileFromWorkspace('jenkins/pipelines/monitor.groovy'))
    }
  }
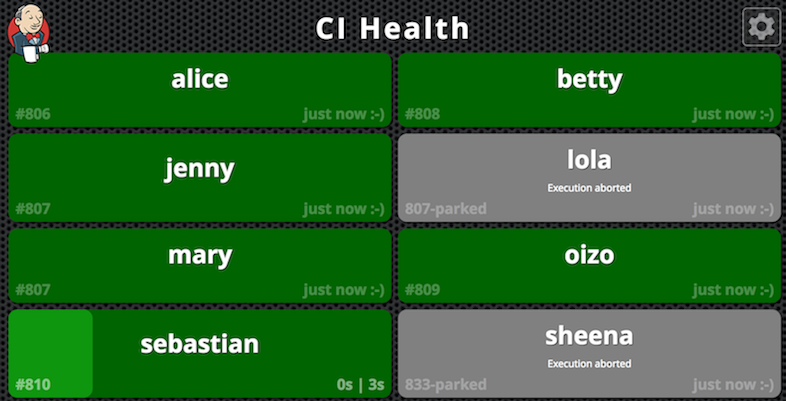
The only reason we instantiated one job for every node is for display purposes, which brings us to the view definition
buildMonitorView('CI Health') {
  description('CI infrastructure status')
  def content = new URL('http://localhost:8080/computer/api/xml?
  wrapper=slaves&xpath=//computer/displayName').getText()
  def build_nodes = new groovy.util.XmlSlurper().parseText(content)
  jobs {
    for(int i = 0; i < build_nodes.displayName.size(); i++){
      def index=i
      def nodeName=build_nodes.displayName[index].text()
      name(nodeName)
    }
}
The code above gives us a nice monitor view:
The interesting parts
We ended up doing quite a few things in this job.
We check to see if a node is offline and if that was deliberate, we also check if the disk on the node is running full and then if the node is not busy we switch the context to within the node and start checking things.
That last stage is the tricky part because it needs to be really, really fast, otherwise we run the risk of blocking executors while the team is working.
The pipeline looks like this:
env.STATION=STATION
@NonCPS
def freeSpaceCheck(monitorData)
{
    def result=true
    monitorData.children().each{
        if (it.name()=="hudson.node_monitors.DiskSpaceMonitor"){
          freeSpace=it.size.text() as Double
          if(freeSpace<6000000000){
            result=false
          }
        }
    }
    return result
}
@NonCPS
def checkIdle(nodeData)
{
  nodeData.idle.text()=="true"
}

def isNodeIdle=true
stage("Node State")
{
  currentBuild.result="SUCCESS"
  def content = new URL("http://localhost:8080/computer/${env.STATION}/api/xml").getText()
  def build_node = new groovy.util.XmlSlurper().parseText(content)
  if (build_node.offline.text()=="true"){
    currentBuild.result = 'FAILED'
    currentBuild.setDisplayName("${env.BUILD_NUMBER}-offline")
  }
  if(build_node.temporarilyOffline.text()=="true")
  {
    currentBuild.result = 'ABORTED'
    currentBuild.setDisplayName("${env.BUILD_NUMBER}-parked")
  }
  if(!freeSpaceCheck(build_node.monitorData)){
    println "WARNING: Disk space is low!"
    currentBuild.result = 'UNSTABLE'
    currentBuild.setDisplayName("${env.BUILD_NUMBER}-nospace")
  }
  isNodeIdle=checkIdle(build_node)
}
stage("Check Node")
{
  if (currentBuild.result=="SUCCESS" && isNodeIdle )
  {
    node(env.STATION){
      //this will run on the node if the node is not busy
    }
  }
}
We subvert the meaning of the job stati a bit (as documented in the description of the job). This is so that we can adhere to “green means relax, yellow means work is coming your way, red means drop everything else and fix it”.
We also use the build display name to hint at the reason for the status.
Those @nonCPS methods are there so that Jenkins does not have a fit trying to serialize the XmlSlurper.
It would have been less code and a lot more readable if I had managed to talk to the Java API, but wierdness happened and the HTTP API does the work.